Power Sensor System Doubles as SWR/Return Loss Measurement Method
By: John Swank, vice president of Engineering, TEGAM
Contents
Calibration system operating principles
Calibration and mismatch error
Basic SWR measurement techniques
Accuracy and resolution analysis
Power range
Measurement resolution
When developing wireless products, engineers are faced with many measurement issues. Two of the biggest and most important issues are return loss and standing wave ratio (SWR).
Return loss is the ratio of incident power to reflected power. SWR, on the other hand, is the ratio of the maximum to minimum voltage on a transmission path.
Although determined differently, both SWR and return loss can be used to represent the divergence of an RF device from a perfect impedance match, for example, 50 W. These parameters are mathematically interchangeable and result from scalar measurements, which may be required for a number of reasons. For instance, it is necessary to make sure that the devices under test (DUTs) meet their specifications, one of which is SWR. Also, modern measurement practices dictate the calculation of a quantitative accuracy value, which is affected by SWR at the port of a microwave device.
There are some obvious ways to measure SWR, such as a network analyzer. However, some less obvious ways may offer advantages, which include: measuring SWR when a direct reading instrument is not available; obtaining results with traceable accuracy; employing the same equipment and test setup used in other measurements on the DUTs
The method described below uses a power sensor calibration system for SWR/return loss measurements. It is a scalar measurement system whose principal function is power sensor calibration. However, when combined with a return loss bridge, it can be used to characterize the SWR performance of passive devices or sensors. Thus, expanded use of this system eliminates the need to purchase separate equipment for SWR measurements.
Calibration system operating principles
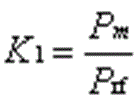
A power sensor calibration system functions by providing a precisely known source of power, which is then measured by the sensor under test. The ratio of the measured value of power to the known value is the calibration factor, K1, of the sensor. This is shown mathematically as follows:

where Pm is the power indicated by the sensor/power meter, and Prf is the actual power from the precision source.
The calibration system itself has to be calibrated against a common standard to provide consistency in measurements. This is termed traceability, and is provided by having a traveling standard, a terminating mount, calibrated by National Institute of Standards and Technology (NIST) or other calibration laboratory. This traveling standard is then used to measure the power emanating from the power source in the calibration system. By this means the source itself is calibrated.
Calibration and mismatch error
Every calibration has associated with it an uncertainty value, which takes into account the inaccuracy and drift of all the instruments and devices used in the calibration. Things such as connector repeatability and temperature stability of the thermistor mount standard affect accuracy. A major source of error in any transfer of power from one instrument to another is due to mismatch, which can cause large errors, especially at higher frequencies.
The maximum error due to mismatch can be deduced from the SWR values of the two instruments or devices being connected together. The two devices in this case are the sensor being calibrated and the precision source, for example, a feedthrough mount. Each of these devices has a specified maximum SWR.
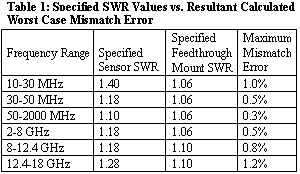
Table 1 lists the SWR specifications for a sensor and a feedthrough mount at various frequencies. The calculated maximum mismatch error induced in a transfer of power from one to the other is shown in the last column.
In general, maximum mismatch error, M, can be calculated from the following equation:

where |G1| and |G2,| are the magnitudes of the reflection coefficients of the two impedances involved. |G| is related to SWR by the following equation:

where S is the SWR.
From these equations it can be seen that the lower the reflection coefficient, and hence the SWR, the lower the potential mismatch error during power transfer from one device to the other. Since SWR is a scalar quantity, it can only be used to estimate the possible error in the transfer. If actual SWRs are not known, the devices' specified SWRs can be used in the equation, under the assumption that they meet their specifications. However, if the actual SWR of even one of the devices is known, then a (presumably) reduced value of estimated maximum mismatch error can be calculated.
Basic SWR measurement techniques
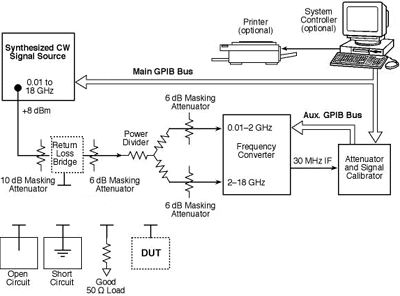
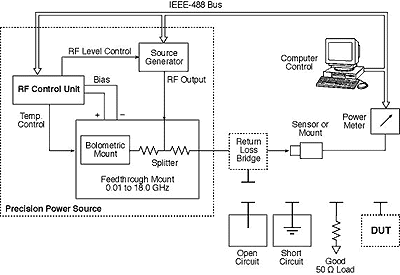
The configuration shown in Figure 1 is the type of scalar system described earlier that can be used for measuring SWR. The open circuit, short circuit, and matched impedance are connected to the test port (lower leg) of the SWR/return loss bridge for calibration purposes, before measuring the DUT.
A measurement configuration similar to that used for a sensor calibration is shown in Figure 2 for a terminating type sensor. Calculation of the sensor calibration factor, K1, was described earlier.
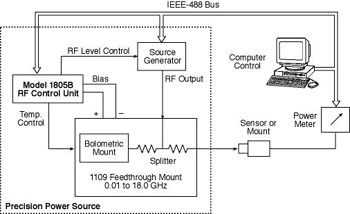
Figure 3, shows the same setup displayed in Figure 2, but with an SWR/return loss bridge connected between the precision source output and the sensor being calibrated. In this setup, two different "calibrations" are performed. First a short or open is connected to the test port of the SWR bridge. This has the effect of reflecting all of the power from the precision source through to the sensor. The DUT is then connected to the test port of the SWR bridge and a second calibration of the sensor performed. In this case only a portion of the power is reflected from the device under test through to the sensor. The ratio of the powers is the return loss of the device under test.
These results displayed in these figures can be expressed mathematically as follows:
Case 1. Total power is reflected from the short/open.

where Prf is the power emanating from the precision source, Pmr is the power registered by the power meter attached to the terminating sensor, and Klr is the calibration factor of the sensor.
Case 2. The DUT is attached to the bridge test port.

where Pmt is the power as now registered by the power meter attached to the terminating sensor, and Klt is the equivalent calibration factor of the sensor. (The calibration factors are denoted by K1 as this is the normal identification of the calibration factor of a terminating sensor.)
In this measurement sequence the so-called calibration factors have little relevance to the performance of the terminating sensor. If calibration measurements are being performed by hand, all that is needed is the power meter readings. However, the calibration system software gives results in terms of calibration factors. To cover a large number of measurement frequencies, it is more expedient to use the software to generate calibration factors.
It can be seen from the equations that a calibration factor is proportional to measured power, so the two can be used interchangeably. Therefore, the return loss of the DUT is the ratio of the so-called calibration factors, such as,
 in power ratio terms, or

Accuracy and resolution analysis
Table 2 shows actual data taken with the setup in Figure 3. The three columns show the calibration factor with a short, an open, and unterminated 10 dB attenuator, resulting in a total return loss of about 20 dB. The short and open columns of Table 2 show that unlike normal calibration conditions, where a calibration factor close to 1.000 is expected, the SWR bridge has a starting point around 0.05.
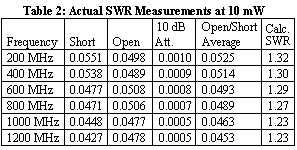
Bridges typically have around 6.5 dB of insertion loss on each transition, giving 13 dB total. This directly translates into a calibration factor around 1/20th of maximum, i.e., 0.05. Starting at 0.05 means that the practical return loss range is limited to about 20 dB, as shown by the unterminated 10 dB attenuator. In SWR terms this is equivalent to 1.22:1.
There are two factors that govern the above range limitation: power range and measurement resolution.
Power range
Power range is defined as a typical level at which the perform sensor calibrations is 1 mW. This means that a calibration factor of 1.0000 at the power meter/sensor being calibrated represents 1 mW. With the bridge in place, as in Figure 3, the working power at the terminating power sensor now starts at a reference level of 0.05 mW or -13 dBm. A DUT with a return loss of 20 dB is then equivalent to a measurement level of -33 dBm.
If the terminating power meter/sensor is a thermistor power standard attached to a power meter, substituted power is measured with a digital voltmeter (DVM). At a power level of -33 dBm, measurement results may not have a high level of accuracy, depending on DVM specifications.
Assuming that the inaccuracies of the power standard and power meter are systematic, and are constant for all the power levels, the major source of inaccuracy is from the DVM. The catalog specification for a typical DVM measurement configuration is ±0.03% + 2 µW. This potential error completely swamps measurements of the power levels mentioned above.
One way to improve matters is to raise the calibration power level. For example, if 10 mW were available, a 20 dB return loss would give measurements around -23 dBm, or 5 µW. This is a tenfold increase in working levels. However, the calibration factors still start at approximately 0.05 as before.
Measurement resolution
A printout from the current calibration system software displays results with a maximum resolution of four decimal places. Therefore, starting with a reference of 0.0500, the 20 dB return loss gives a reading of approximately 0.0005, as shown for the unterminated 10 dB attenuator in Table 2. There is, however, a technique that can improve on this resolution limitation.
Figure 4 shows an arrangement whereby a terminating power standard has an attenuator between it and the splitter. This is the basis of the "H" series standards. The operating power of the H series standard itself is 10 dB less than the power emanating from the output port of the splitter. However, the "H" series mounts have calibration factors on the order of 0.1, so that with the bridge in place the starting point of the return loss exercise is still 0.05 as before.
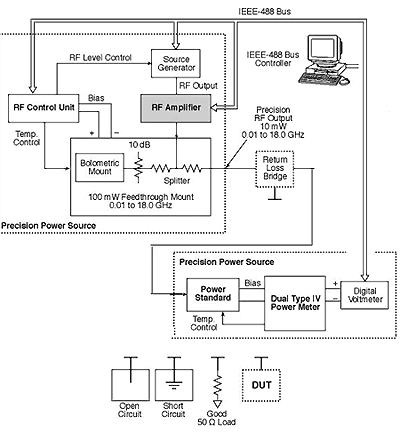
If, however, a series of calibration factors around 1 was assumed for the "H" series mount, the starting or reference point for the fully reflected power situation would now be approximately 0.5, a tenfold increase. This is because the output from the precision source is 10 dB higher than the Prf calculations would suggest, reducing the effect of the bridge to approximately 3 dB. A 20 dB return loss would now be equivalent to a measurement calibration factor of approximately 0.0050, and a 30 dB return loss would give a figure of approximately 0.0005. A return loss of 30 dB is equivalent to an SWR of 1.065, which now becomes the rough limit on the range.
This approach also has the advantage that the operating power is higher, as described earlier. In fact, operating power is now limited only by the available amplifier, which should provide at least 100 mW.
Since the power standard calibration factors drop out of the mathematics for the process, it is valid to use the calibration factors for any feedthrough mount. Thus the calibration factors for one feedthrough could be used where the actual mount is another one.
Using the setup shown in Figure 4, with a power meter, standard DVM, and the precision source output at 10 mW, the following is a typical uncertainty calculation:
Precision Output = 10 mW,
Loss through bridge = 13 dB,
Reference level from bridge = 0.5 mW
Output for a 20 dB return loss = 5 µW
Accuracy of Model 1806 with typical DVM = ±0.03% ± 2 µW.
Resulting uncertainty at 500 µW = ±0.43%, and at 5 µW = ±40.03%.
Ignoring everything except the 40% uncertainty level, which is approximately equivalent to ±1.5 dB, this translates to an SWR reading between 1.18:1 and 1.27:1, or an actual computed value of 1.22:1. The same exercise for a 30 dB return loss yields an SWR range from 1.00:1 to 1.15:1, or an actual computed value of 1.065:1.
If the standard 6.5 digit DVM is replaced by, say, an eight digit DVM, the equivalent results for a 20 and 30 dB actual return loss are approximately 1.221:1 to 1.223:1 and 1.062:1 to 1.069:1, or actual computed values of 1.222:1 and 1.065:1 respectively.
The previous analysis totally neglects any effects due to the return loss bridge itself. In fact, a typical bridge might have a guaranteed directivity of only 35 dB. The directivity is a measure of the suppression of the incident signal at the output of the bridge. A 35 dB directivity is equivalent to an SWR of 1.036:1. This is the limit of the bridge's capability. If the DUT has a return loss of 30 dB, the directivity would possibly yield an answer as high as 1.075:1 instead of 1.065:1. Even with a bridge directivity of 40 dB, the answer for an actual SWR of 1.065:1 could be 1.069:1. With a high resolution DVM and higher power levels, bridge performance becomes the ultimate limitation on measurement accuracy.
About the author:
John Swank, vice president of Engineering, Tegam Inc., 10 Tegam Way, Geneva, OH 44041. Tel: 440-466-6100; Fax: 440-466-6110.
Edited by Robert Keenan
